Automated Storytelling
Overview
As Internet of Things (IoT) and occupancy detection technologies become more common in households, more information about living patterns become accessible. Previous research explored data visualization techniques that convert numbers into informative graphs so that a user can determine a smart home policy. We want to adapt this end-user development approach to one in which the home learns by itself how to operate using appliance and occupancy detection data. We use data sets covering a 3 month period from a Dutch household to create inference models which generate a data-driven storytelling of household activity. Automated storytelling could help people make energy efficient choices, alarm users of real world changes and dangers, and elucidate interesting patterns about one household amongst others in the neighborhood. Link to short paper: Short paper
Data Set Appliance and Home Layout
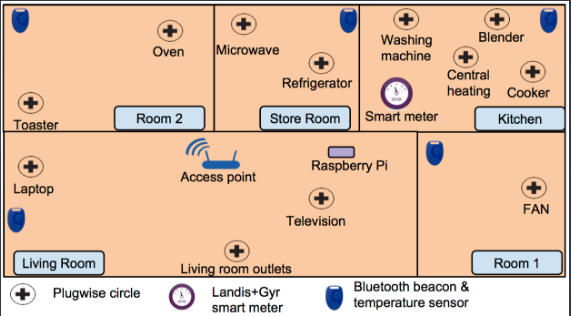
In this case, some rooms are labeled, others are not. Also, we know appliance locations in this case, but regularly this information will not be provided from occupancy sensors and appliance data.
How it works
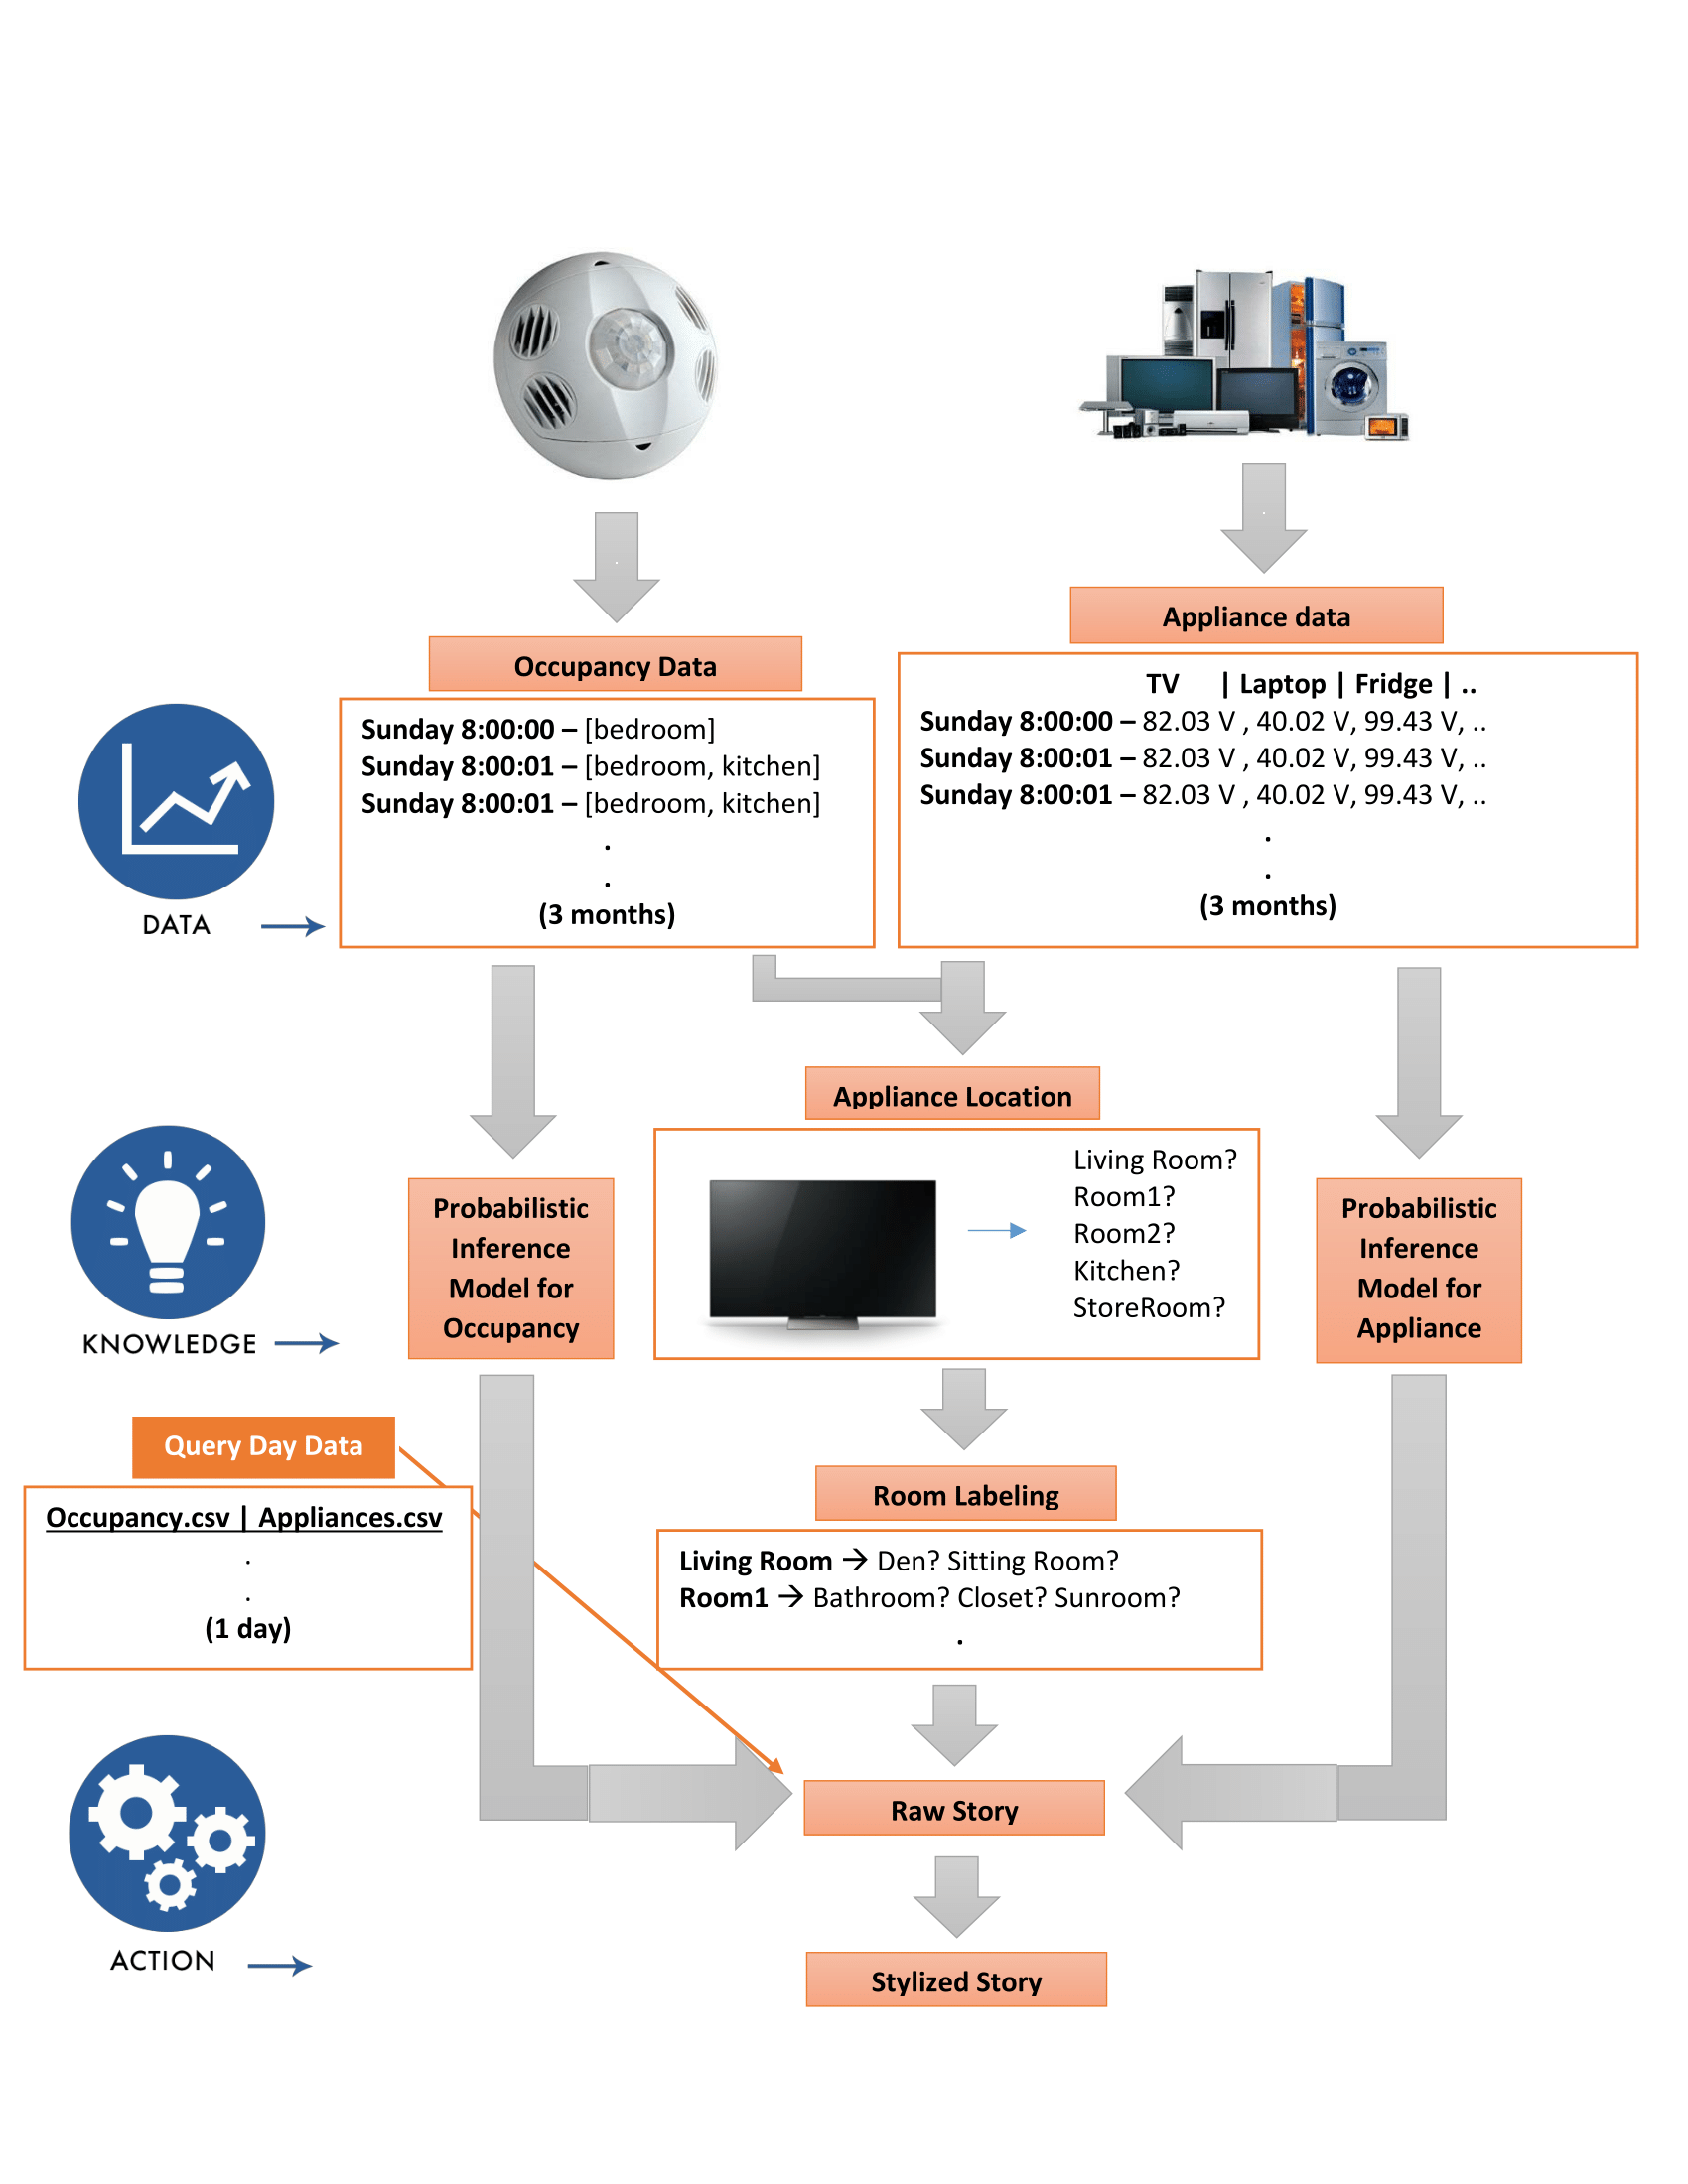
Example Result
Given a day of data consisting of occupancy and appliance usage for some Monday, here is the raw story that is output:
On Monday, At 12:00 AM, a person is very likely to be in the bedroom but is instead in the kitchen and using laptop, mains, and sockets more than regular. At 08:00 AM, a person should be in the Kitchen but is in the bedroom. At 03:00 PM, a person is probably in the LivingRoom but is instead in the kitchen and using laptop less than regular, TV more than regular.